

Hello! Today we are going to test MongoDB with a thousand millions (1.000.000.000) of geolocation points (latitude and longitude).
This is one of a series of 3 search engines (MongoDB, Solr and Elasticsearch) that I wanted to know if they are really ready to work under a huge amount of data.
These tests are a bit peculiar as I did them creating geolocation points to draw them inside the map of a project. In other words, each record is a latitude and longitude pair.
Ok, the first thing that I want to show is the testing machine:
As you can see it’s a medium/high performance computer. It is not a testing server but it’s more than enough for these tests.
I have installed MongoDB with the default options. I have not changed any configuration parameter.
So the first part of these tests was the data loading. For that, I did the test loading the same amount of geolocation points using the mongo’s import (“mongoimport” command) and using nodejs.
Finally I chose Nodejs because the loading times hardly differed between the two tools with the advantage that Nodejs I can log everything that's happening during the data loading bulk operation.
With “bulk operation” I mean that instead of doing an insert for each of the "Points" (coord set), i have inserted the points in bulks with thousands of them. This is only to avoid bottleneck in read/write operations.
NOTE: 1k = 1 thousand, 1m = 1 million.
I did the insertion tests with 10k, 100k, 1m and 2m insertions respectively. I couldn't test with more inserts because I had not enough RAM. In fact, the more geolocation points I puted in the queue the more RAM he eats. With over 2m inserts I runed out of memory and Nodejs failed.
Finally I chose the option of 100k packages in 10k cycles and 1m in 1k cycles. So let’s go:
![]() In the image, each measurement corresponds with the time that MongoDB has spent on the insertion of 100k geolocation points. The average insertion time was 1344ms.
In the image, each measurement corresponds with the time that MongoDB has spent on the insertion of 100k geolocation points. The average insertion time was 1344ms.
![]() In this case, when inserting a quantity 10 times greater than the previous exercise the average was finally of 14910ms. for completing the data insertion.
In this case, when inserting a quantity 10 times greater than the previous exercise the average was finally of 14910ms. for completing the data insertion.
So if Mongo is able to insert an average of 74399 geolocation points per second when we send packages of 100k and 67066 geolocation points per second when we send 1m we are facing a loss of performance of 44% when inserting greater packages.
So as the insertion of 100k was faster I decided to use this one to load the 1000 millions. In theory it has spent 224 minutes (3h and 44 min). I say theoretically because I'm extrapolating data. I did not test the total when I did the insertion. But let's say that numbers lying.
The entire DB theoretically weighs 91.9GB but in the disc it only weighs 43.04GB thanks to the WiredTiger engine of MongoDB that compress the data in the disc.
It’s also interesting to say when I indexed the DB (forget about doing searches without an index) it increased approximately 25GB but with the compression applied it "only" uses 11.7GB.
With all this data, we have approximately 54.74GB of disc space for the database and the index.
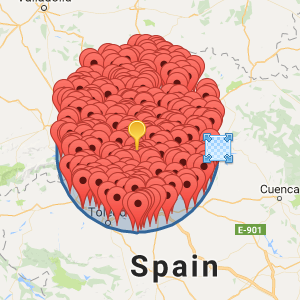
Is time to do the tests and see what Mongo can do with all this data. As I mentioned before, they are geospatial searches so the rearches were made as radial ones.
![]() I honestly thought the measurements were wrong when I saw this. It took 3ms to find an average of 5.6 points on the map. I CAN’T BELIEVE IT! But yes. I re-test it and test again with higher radios and that confirm the data consistency. I’m amazed.
I honestly thought the measurements were wrong when I saw this. It took 3ms to find an average of 5.6 points on the map. I CAN’T BELIEVE IT! But yes. I re-test it and test again with higher radios and that confirm the data consistency. I’m amazed.
![]() Curiously it finds almost the same amount of points and the speed is still amazing.
Curiously it finds almost the same amount of points and the speed is still amazing.
![]() Now the results change a little bit. We started to doing tests that return more results and response times beyond 5ms. In searches within 10km we found an average of about 730 points with an average search time of 268ms.
Now the results change a little bit. We started to doing tests that return more results and response times beyond 5ms. In searches within 10km we found an average of about 730 points with an average search time of 268ms.
From this radius I include the amount of RAM that consumes this search so that we get an idea about the RAM it uses. In this case searches within 10km use 100mb of RAM for each search.
![]() In search within 50 kilometers the results for response times and RAM usage they become more interesting. The result was 15022 points in 4250ms with a RAM consumtion of 800mb per query.
In search within 50 kilometers the results for response times and RAM usage they become more interesting. The result was 15022 points in 4250ms with a RAM consumtion of 800mb per query.
![]() The last test. In this case we have found an average of 63317 points in 14323ms with a RAM consumtion of 3.6GB per query.
The last test. In this case we have found an average of 63317 points in 14323ms with a RAM consumtion of 3.6GB per query.
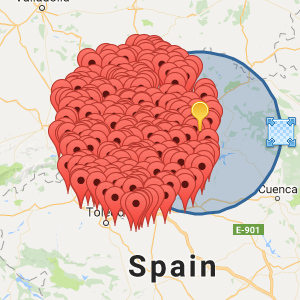
Partial searches are a search made in envelope of a previous search and therefore already cached.
On this exercise I made a search within a 10 kilometers away and 50 kilometers away. Then I did a search that will cover half of the first search and the other half of an area that had not previously been queried.
Why I did that? Just to confirm that search results were being cached in RAM at the same time as they were being performing.


As result of these tests, I have obtained the following information:
For searches withing a radius of 10km:
For searches withing a radius of 50km:
As you can see it is easily confirmed that the searched points, while not rebooting MongoDB are stored in RAM.
I hope all this is useful to you. I will talk soon about Solr with the same tests to see how it goes.
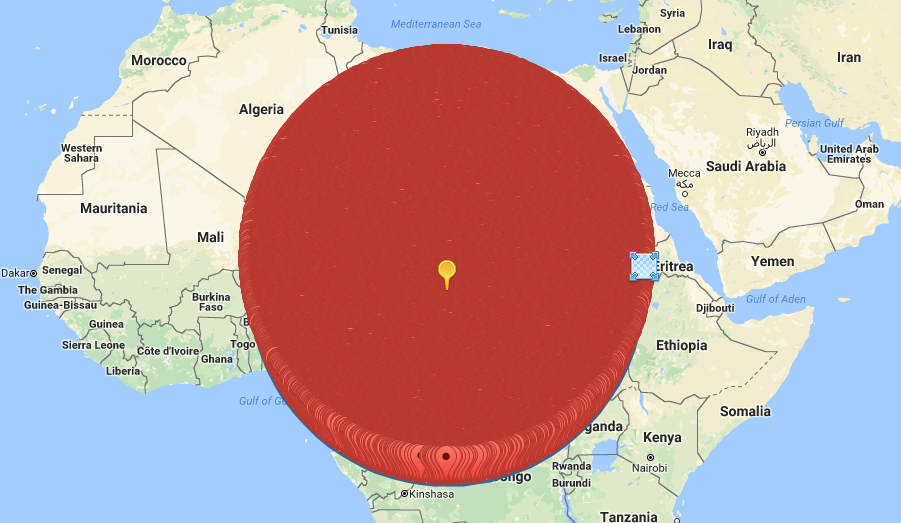
One thing more. Capy, How do you see a 2000km search drawn on a map? like this!:

Regards!
Add new comment